
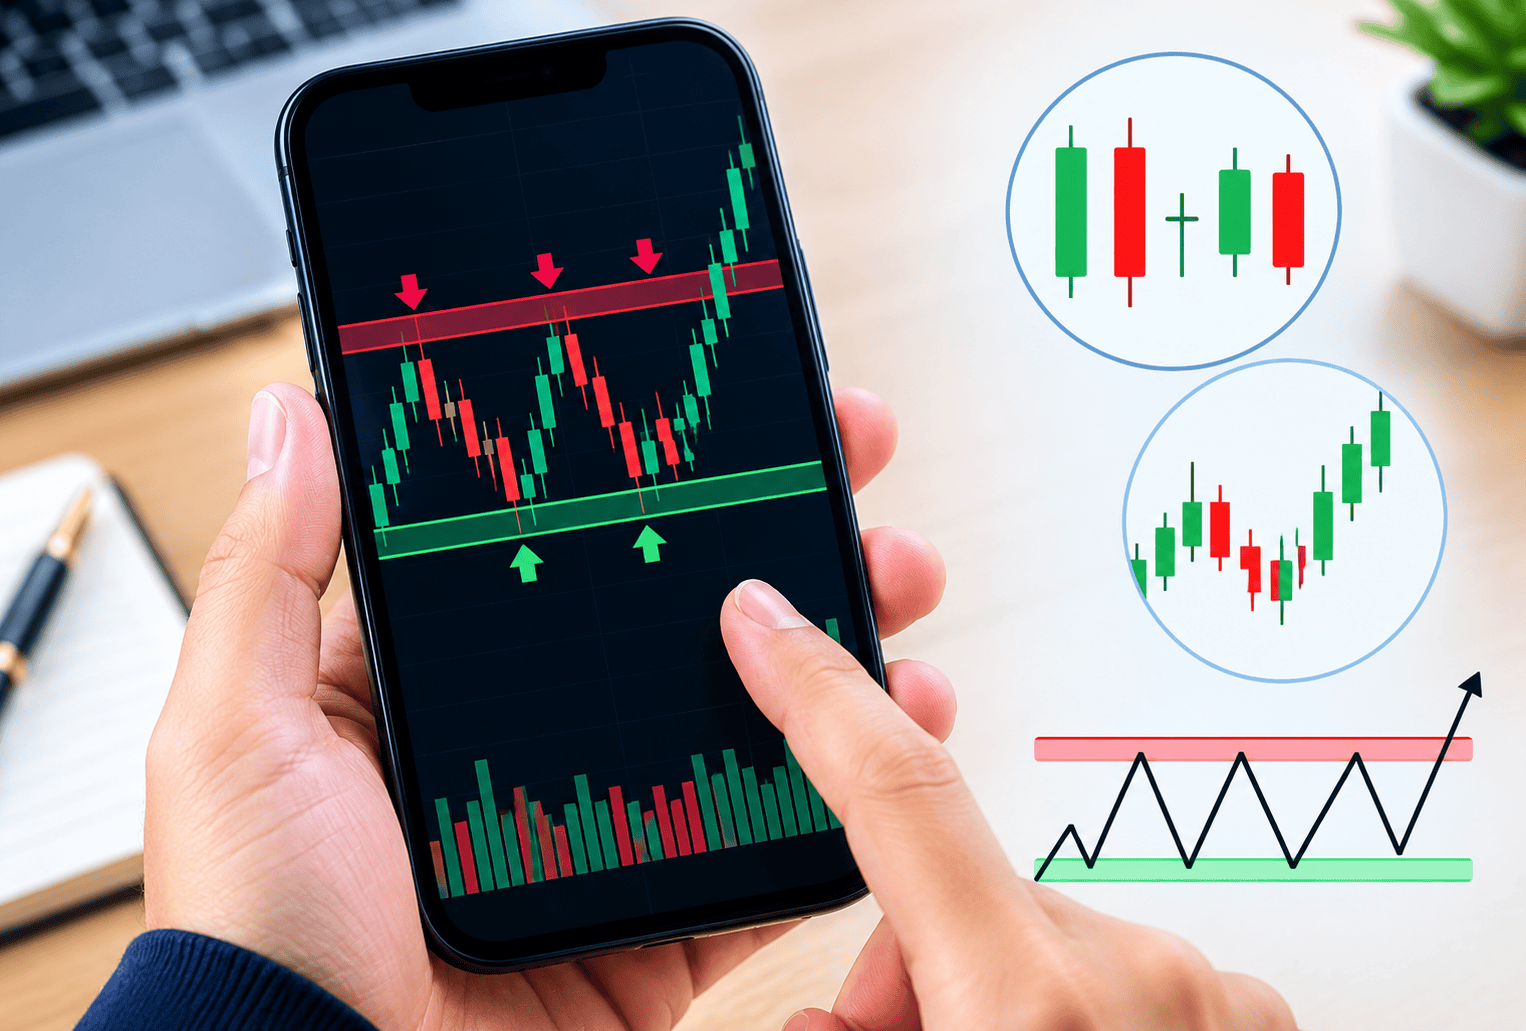

Discover how candlestick charts work, understand key patterns, and learn how traders use them to analyze market trends and make informed trading decisions.
- Understanding Candlestick Chart Patterns
- What Candlestick Patterns Can Tell Traders
- What Are Support and Resistance Levels?
- How to Analyze Stock Charts Using a Trading App
- Step 1: Select a Stock and Configure the Chart
- Step 2: Choose a Suitable Timeframe
- Step 3: Identify Key Support and Resistance Levels
- Step 4: Look for Confirmation
- Step 5: Manage Risk Before Trading
- Common Mistakes to Avoid When Reading Charts
- Conclusion
Stock charts represent price changes of shares in the market and allow traders to analyse the situation on the stock market. Traders can better assess market behavior by learning to recognize candlestick formations and locate important support and resistance areas on price charts.
Analyzing these details on a small mobile display can sometimes be difficult. Fortunately, trading apps offer convenient charting features and analytical tools that help users track price movements and evaluate market trends on the go.
Understanding Candlestick Chart Patterns
A candlestick displays how a stock or other financial asset’s price changes over a specific timeframe. Each candle highlights four essential price values:
- Open: The price at the beginning of the selected trading period.
- Close: The price recorded when that period finishes.
- High: The maximum price reached during the timeframe.
- Low: The minimum price recorded during the timeframe.
The rectangular part of a candle is called the body. The thin lines extending above or below it are known as wicks or shadows.
A green (or bullish) candle means that the closing price is higher than the opening price. A red (or bearish) candle means that the closing price is lower than the opening price. The colours may vary depending on the settings of the chart.
What Candlestick Patterns Can Tell Traders
Candlestick patterns provide clues about price behaviour, but they should not be treated as automatic buy or sell signals.
A long candlestick body reflects a significant gap between the opening and closing prices, while a short body indicates only a minor difference. Extended wicks reveal how far the price moved beyond the body before the trading period ended.
For example, a long upper shadow means that the share opened higher but soon closed back down. Traders can take this information in context of trading volumes and the overall trend to make conclusions.
What Are Support and Resistance Levels?
Support and resistance are key price zones where an asset has previously struggled to move lower or higher. Traders study these areas to anticipate potential price reactions when the market revisits them.
Understanding Support
A support zone is a price range where buying pressure has previously helped stabilize an asset and limit its downward movement. When prices approach this zone, traders may look for signs of renewed buying.
Understanding Resistance
Resistance is an area where selling interest has previously slowed or stopped a price rise. Traders can analyze price reactions as the market moves closer to this key zone.
How to Analyze Stock Charts Using a Trading App
Mobile charting tools in trading apps help users track changing stock prices and identify important price zones. Beginners can follow these practical steps to learn how to read charts, recognize patterns, and interpret market movements.
Step 1: Select a Stock and Configure the Chart
Select a stock on your trading platform and switch the chart display to candlestick mode before beginning your analysis. After that, they need to check the stock’s name and exchange before proceeding to analyze the security’s price.
Step 2: Choose a Suitable Timeframe
Lower timeframes reveal more frequent price fluctuations, whereas daily charts offer a clearer picture of the overall market trend. For beginners, it might be helpful to start with daily charts to better understand how prices move in general.
Step 3: Identify Key Support and Resistance Levels
Use the application’s tools to mark the areas on the graph, where the price repeatedly bounced and turned. Avoid cluttering the chart with too many marked zones, as this can make price analysis more difficult.
Step 4: Look for Confirmation
Watch the market closely, as the situation can change dramatically and take your forecast in another direction. The pattern of candles, volumes, and news can be helpful in this scenario, but it doesn’t promise any outcomes.
Step 5: Manage Risk Before Trading
Traders should decide in advance how much they are willing to risk before opening a position. Setting a stop-loss order can help limit potential losses if the market moves against their expectations.
Common Mistakes to Avoid When Reading Charts
Overlooking important market conditions can lead to misleading chart interpretations and poor trading decisions. Traders should consider relevant factors before relying on chart patterns to assess market movements.
- Traders should not base their decision solely on one type of candlestick pattern.
- Examine the bigger picture and the prevailing trends in the market rather than focus on minor fluctuations.
- Only mark the relevant support and resistance levels to avoid cluttering the chart.
- Same candlestick patterns could have differing implications at different times.
- Before placing any trade, it is essential to devise a proper plan and consider the amount of risk that one is willing to take.
Consistent practice with an online trading app can help traders improve their ability to recognize and interpret candlestick formations.
Conclusion
By studying candlestick signals alongside support and resistance zones, traders can better understand market behavior and spot potential opportunities to enter or exit a trade. The understanding process can take time, as there is no chart pattern which suggests a sure outcome. Before getting into trading, it is essential for beginners to research and study charts, conduct research on the stock, and set up risk management strategies. Brokers like 5paisa can be explored based on charting options, services and charges.
